 GeoData.NZ
MCMURDO DRY VALLEYS
Type of resources
Available actions
Topics
Keywords
Contact for the resource
Provided by
Years
Update frequencies
status
-
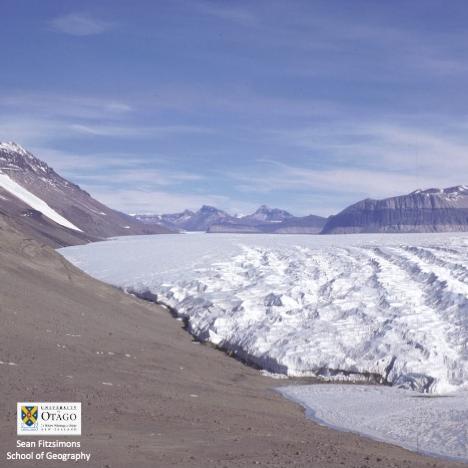
The structural glaciology and movement of the Taylor Glacier, was investigated over several seasons (98-01) by excavating a tunnel in the right side of the Taylor Glacier, 1.5km upstream of the terminus, to provide access to basal ice and the glacier substrate. Basal ice was sampled and analysed for concentration of base cations and chlorides present. Strain arrays and precision dial gauges were installed to monitor movement and deformation of the tunnel and ice velocity. In situ samples of clean and debris bearing glacier ice shear samples were taken from the basal ice to test in a laboratory. The tunnel was re-cut 1.3km upstream of the terminus in the 99-00 season as the other had closed in, with strain arrays and plumb lines installed and basal ice re-sampled. Ice cores were sampled for mechanical tests from the tunnel and the glacier surface. Ice cores were taken from the ice margin of Lake Bonny. Strain arrays and plumb lines were resurveyed and the deformation of the tunnel measured. This metadata record represents: - Data set from Taylor Glacier tunnel - Photographs of tunnel excavation - Video of tunnel excavation Further details are provided at: Fitzsimons, S., Samyn, D., & Lorrain, R (2024). Deformation, strength and tectonic evolution of basal ice in Taylor Glacier, Antarctica. Journal of Geophysical Research: Earth Surface, 129, e2023JF007456. https://doi.org/10.1029/2023JF007456 GET DATA: https://doi.org/10.5281/zenodo.8232003
-
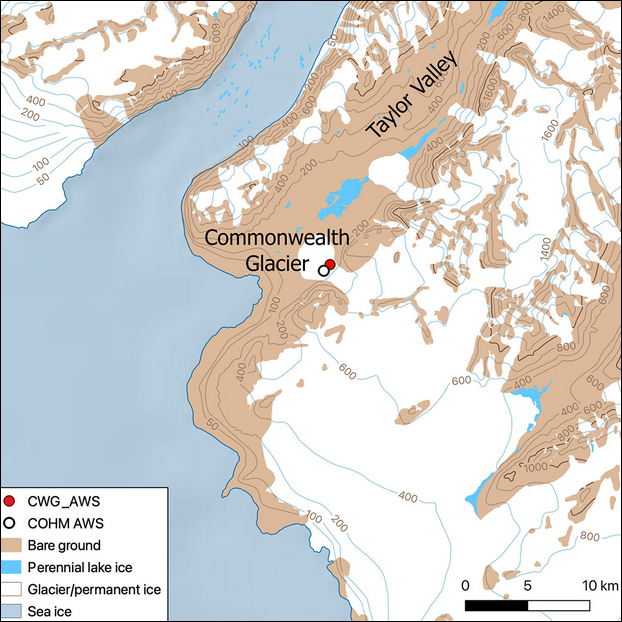
This metadata record represents the code and data used for the first application of WRF-Hydro/Glacier in the McMurdo Dry Valleys (Commonwealth Glacier), which as a fully distributed hydrological model has the capability to resolve the streams from the glaciers to the bare land that surround them. We applied a glacier and hydrology model in the McMurdo Dry Valleys (MDV) to model the start and duration of melt over a summer in this extreme polar desert. To do so, we found it necessary to prevent the drainage of melt into ice and optimize the albedo scheme. We show that simulating albedo (for the first time in the MDV) is critical to modelling the feedbacks of albedo, snowfall and melt in the region. This is a first step towards more complex spatial modelling of melt and streamflow. The Zenodo data includes output point data (*.csv) and namelist used in: Pletzer, T., Conway, J.P., Cullen, N.J., Eidhammer, T., & Katurji, M. (2024). The application and modification of WRF-Hydro/Glacier to a cold-based Antarctic glacier. *Hydrology and Earth System Sciences*, 28(3), 459-478. https://doi.org/10.5194/hess-28-459-2024 The modifications to the WRF-Hydro/Glacier model used in the paper can be found on GitHub: https://github.com/tpletzer/wrf_hydro_nwm_coldglacier GET DATA: https://doi.org/10.5281/zenodo.10565032
-
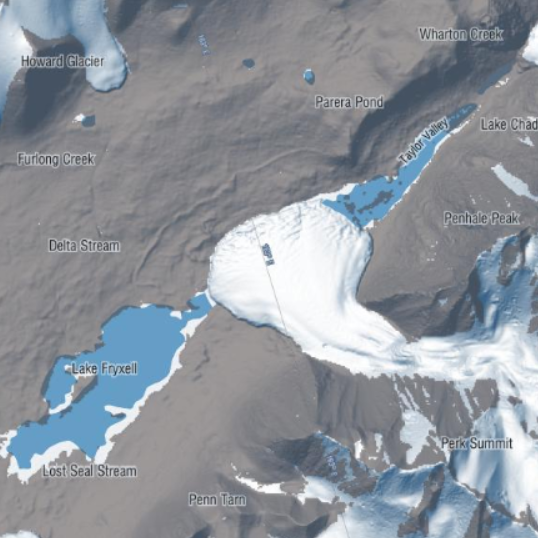
This metadata record represents meteorological data and in situ and isotopic measurements of the isotopic ratio of water vapor from the ablating ice from two lakes in the McMurdo Dry Valleys, Antarctica. Lake ice and water samples (from the surface water and at depth via SCUBA) were collected in vials. Ice samples at Lake Bonney were collected daily, and at Lake Fryxell samples were collected approximately twice per day. Lake ice samples were also collected at Lake Fryxell along three transects spaced approximately every 300 to 500 m (meters) across the lake surface. Water vapor isotope flux measurements were collected via air inlets which were installed at 0.5, 1.0, and 3.0 m on the tower using ¼″ OD Teflon tubes. The lines were insulated and continuously pumped at a flow rate of approximately 10 L min−1 using a secondary pump. Meteorological measurements with a Vaisala HMP100 probe for temperature and relative humidity readings and an RM Young wind vane (model 05108) for wind velocity measurements, at heights of 3.0 and 0.5 m. Air temperature, relative humidity, wind velocity, and lake surface temperature measurements were recorded every minute via a Campbell Scientific CR1000 data logger. Spatial Coordinates: Lake Bonney (-77.60672778, 162.44982222) Lake Fryxell (-77.60672778, 163.12508611) Further details are provided at: A. W. Bellagamba, M. Berkelhammer, L. Winslow, P. T. Doran, K. F. Myers, S. Devlin & I. Hawes (2021) The magnitude and climate sensitivity of isotopic fractionation from ablation of Antarctic Dry Valley lakes, Arctic, Antarctic, and Alpine Research, 53:1, 352-371, https://doi.org/10.1080/15230430.2021.2001899 GET DATA: https://uofi.app.box.com/s/6vakvltbsn1nhrpzudffclrn5iufpoux/folder/88268262341
-
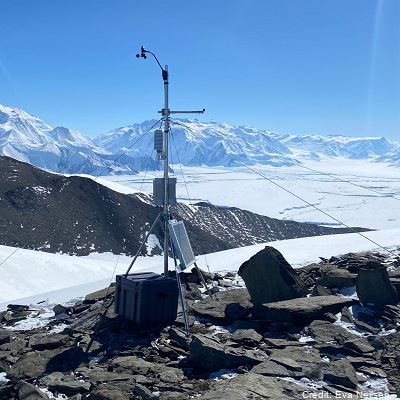
Automated weather stations were installed to measure local scale weather conditions at Miers Valley, Miers Ridge, Commonwealth Glacier, Cape Christie, and Haystack Mountain. Miers Valley, Miers Ridge and Haystack Mountain stations have been operating since early 2021, Haystack, Commonwealth Glacier and Cape Christie were installed in December 2021, 2022, and 2023, respectively. Data are available on request in NetCDF. Parameters: - average air temperature (C) - average relative humidity (%) - average short wave in (W/m2) - average pressure (hPa) - wind speed (ms-1) - wind direction (true bearing degrees) - wind standard deviation Coordinates: - Miers Valley (-78.09805, 163.794283) - Miers Ridge (-78.123205, 163.863319) - Commonwealth Glacier (-77.563987, 163.281064) - Cape Christie (-72.29722222, 169.9847222) - Haystack Mountain (-77.05, 162.585) GET DATA: marwan.katurji@canterbury.ac.nz
-
The New Zealand Terrestrial Antarctic Biocomplexity Survey (nzTABS) is the largest and most comprehensive interdisciplinary landscape-scale study of terrestrial biology ever undertaken in Antarctica, incorporating fieldwork of 1500+ person days in 6 of the Dry Valleys (total area of 6500 km2), strategic sampling of over 1200 sites designed to encompass the landscape heterogeneities in the ecosystem, and a range of high-resolution remote sensing data. All samples were collected during the month of January in each sampling year. Initially a 220 km2 study area, consisting of Miers, Marshall, and Garwood Valleys as well as Shangri-La, was divided into more than 600 geographically and geologically distinct ice-free sectors (hereinafter “tiles”) using remote-sensing data and published soil maps. Tile boundaries were delineated where the combination of geographical and geological variables changed, and on-the-ground assessments were carried out in November 2008 to confirm the reliability of delineations. 554 tiles were chosen for sampling to encompass the entire range of geographical and geological heterogeneity. Sampling of soils and biological communities was carried out over two successive austral summers (January 2009 and January 2010). Surveys were conducted for vegetation (i.e., mosses, lichens, algal and cyanobacterial mats), lithic microbial communities, and invertebrates at each sampling site (verified by GPS to be inside its respective tile), followed by collection of bulk soil samples for additional analyses, including molecular analyses of bacteria (total and cyanobacteria-only) and fungi. In addition, a number of key variables were derived from satellite imagery, including surface soil temperature, a topographically derived ‘wetness index’, and distance to the coast. After quality control, data for 490 samples were included in the analysis. These data represent geochemistry and geomorphology to population genetics and microbial ecology parameters. Further details are provided at https://doi.org/10.1038/s42003-018-0274-5. Please cite the data with the following citation: Lee, C.K., Laughlin, D.C., Bottos, E.M. et al. Biotic interactions are an unexpected yet critical control on the complexity of an abiotically driven polar ecosystem. Commun Biol 2, 62 (2019). https://doi.org/10.1038/s42003-018-0274-5
-
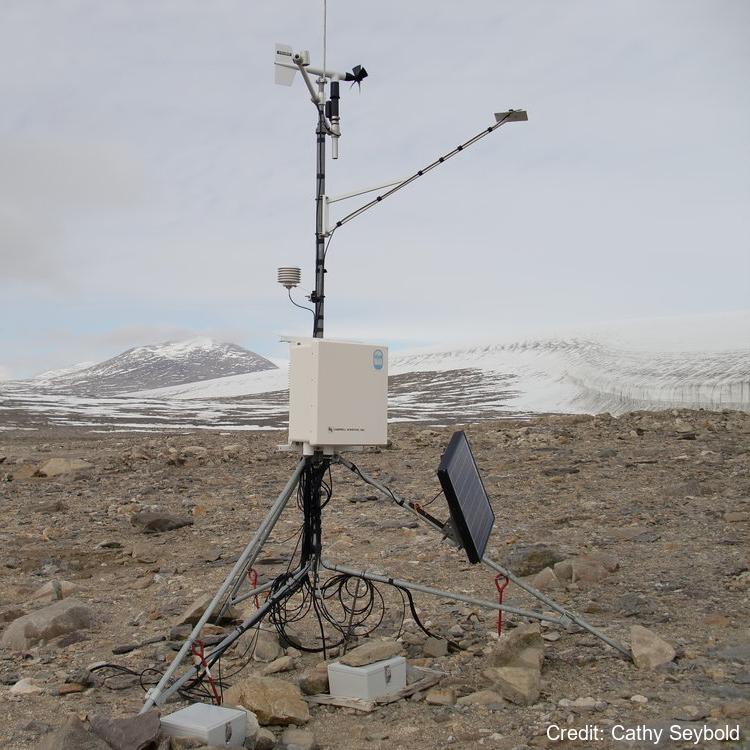
There are nine soil climate stations located in the McMurdo Sound region of Antarctica that were established starting in 1999 through 2011. Four of the stations are in the Dry Valleys and four are located along the coast. The ninth station is located on Mt. Fleming near the polar plateau. Each climate station measures atmospheric parameters (air temperature, relative humidity, wind speed and direction, and solar radiation) and soil parameters (soil moisture and temperature) that extend from the active layer (seasonally thawed layer) into the permafrost. Recorded measurements are made on an hourly basis. At each climate station the soils have been sampled and characterized at the Kellogg Soil Survey Laboratory. There are two borehole stations at Bull Pass and Marble Point which measure ground temperature and are used to study permafrost temperatures and active-layer thermal regimes to a depth of 30m. Further station and borehole details including the instruments' specification, maintenance, and measured variables are described in each site's data "_description" folder. GET DATA: https://www.nrcs.usda.gov/resources/data-and-reports/soil-climate-research-stations